Research · working paper

Inspection-first risk: seeing the tail of Indian ODC movement before the loss.

Re-Engineering Inland Transport Risk: A System-Powered Inspection Stack for Tail-Risk Detection in Indian Over-Dimensional Cargo Movement

Varun Gowariker, Murugan Lakshmanan and Bhavani N.

  • Written 25 Dec 2025
  • Posted on SSRN 10 Feb 2026
  • 54 pages
  • Zenodo, CC BY 4.0
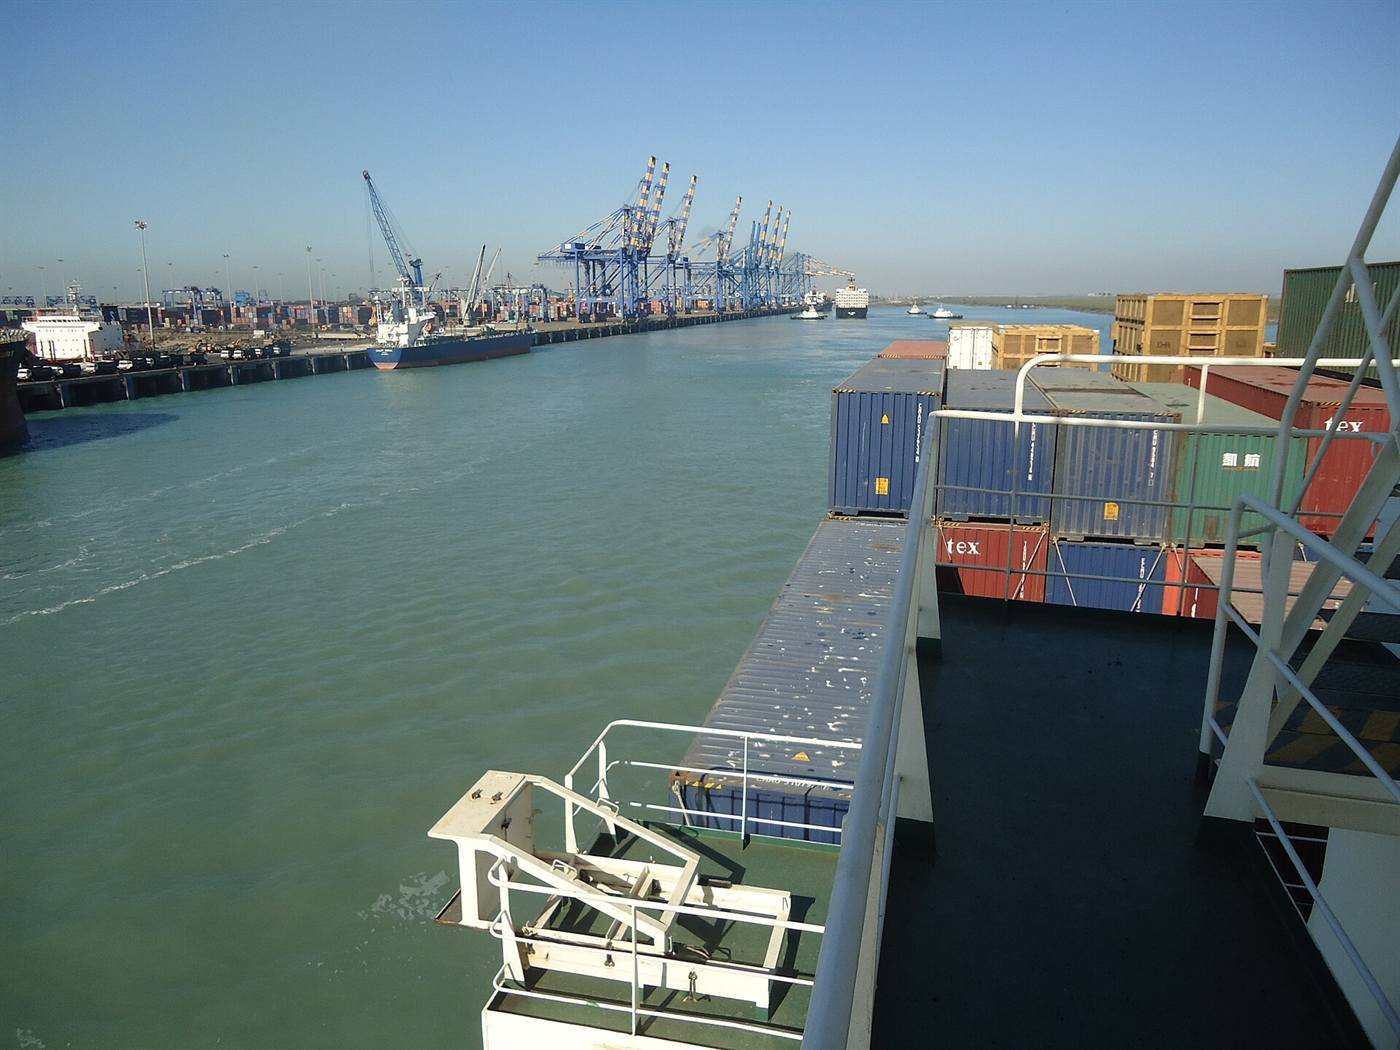
Container cranes and a cargo ship at Mundra port, Gujarat, seen from a ship's deck.
Photo: Felix Dance, CC BY 2.0, via Wikimedia Commons

The paper in numbers

Who is reading it, and where.

Real counts from the two repositories, read on 18 October 2026. The Zenodo count refreshes live when your browser can reach Zenodo.

0Views across both
0Downloads across both
54Pages (SSRN)
2Open repositories

Views and downloads by repository

Share of all views

Share of all downloads

Downloads per 100 views

See the data as a table
Counts reported by each repository on 18 October 2026
RepositoryViewsDownloads
SSRN9726
Zenodo2675

Counts change over time and each site counts views and downloads in its own way, so compare within a repository rather than across them. Zenodo's file download is restricted on the record page, which keeps its download count low.

The question

Claims tell you what went wrong. Inspections tell you what is about to.

Risk on Indian roads is mostly judged from claims, insurer loss runs and retrospective surveys. They arrive after the cargo has moved, and they miss how risk builds during an over-dimensional or over-weight movement.

Where the information arrives

Where the information arrives: claims-first against inspection-firstIn a claims-first process the useful evidence appears only after a loss. In an inspection-first process it is captured and reviewed before the cargo moves.Claims-first: evidence arrives after the lossLoadMoveLossClaimSurveyLearningInspection-first: evidence arrives before the moveInspectVerifyReviewMoveUnloadLearning

Method

From a standard inspection to a view of the tail.

  1. 1. InspectStructured inspection protocols and operational SOPs capture the cargo, the vehicle, the route and the securing the same way every time.
  2. 2. CollectAnonymised 2025 inspection outputs record shipment frequency, monetary exposure and delay across carriers, routes and consignees.
  3. 3. AnalyseNetwork analytics: Herfindahl-Hirschman concentration, P90 tail delays and risk heatmaps show where risk gathers.
  4. 4. ControlInspection-driven SOPs act upstream, so tail risk is reduced before dispatch instead of settled after a loss.

Findings, drawn

Seven findings, drawn from the data.

Each card states the finding, draws it from the 2025 inspection file, and says what an inspection record changes. Two of the charts are interactive.

Tail risk (P90)

Where the tail sits

Finding. Tail delays, not averages, explain volatility.

P90

How to read it, and what inspection changes

Reading the chart. The mean delay across 242 inspections is 1.41 days and P90 is 2, yet the slowest reached 11 days. Drag the percentile to see how thin the tail is and how far it runs.

What inspection changes. An inspection record per move shows which loads, routes and carriers populate the tail, so they can be acted on before dispatch.

Concentration (HHI)

Concentration: shipments against exposure

Finding. Operational concentration exceeds financial concentration.

What if the shares moved?

How to read it, and what inspection changes

Reading the chart. By carrier the shipment index is 2,518 and the exposure index is 2,233; both are high. Routes (408 and 422) and consignees (347 and 329) are well spread. Below, move the shares and watch the index respond.

What inspection changes. Dependence on a few carriers is greater than the money alone suggests, so governance controls belong on the carrier panel.

Frequency against exposure

Frequent is not the same as exposed

Finding. High exposure does not imply high frequency.

Hover or tab to a mark for its value.

How to read it, and what inspection changes

Reading the chart. Each bubble is a carrier. Carrier 03 made 18 inspections yet carries about ₹34 Cr and a P90 delay of 4.5 days; Carrier 09 made 6 and has the worst P90 at 5.5 days.

What inspection changes. Ranking by shipment count would miss them. Exposure and tail weighted inspection catches them.

Routes

Quiet routes, loud delays

Finding. Low-traffic routes can show disproportionate delays.

Hover or tab to a mark for its value.

How to read it, and what inspection changes

Reading the chart. Pune to Golaghat has two inspections and a P90 of 10.7 days; Pune to Hyderabad has one at 8 days. The busiest route, Pune to Ahmedabad, holds at 2 days across 33 inspections.

What inspection changes. Thin routes get less attention and less history. A standard inspection gives them the same evidence as a busy one.

Carrier by route heatmap

Risk lives in combinations

Finding. Loss potential clusters in specific carrier and route combinations.

Hover or tab to a mark for its value.

How to read it, and what inspection changes

Reading the chart. On Pune to Surat the P90 is 1.0 day for one carrier and 3.8 days for another. Neither the route nor the carrier explains it alone.

What inspection changes. Inspect the pair, not the parts: the same route can be safe with one carrier and exposed with another.

Consignee concentration

Consignees as exposure amplifiers

Finding. Consignees aggregate exposure across routes and carriers.

Hover or tab to a mark for its value.

How to read it, and what inspection changes

Reading the chart. The top ten of 89 consignees hold 48% of exposure and the top 30 hold 76%.

What inspection changes. Demand-side exposure shapes contract design and inspection intensity, which claims-only models underweight.

Programme growth

Inspection volume through 2025

Finding. Inspection-native data accumulates as the programme scales.

Hover or tab to a mark for its value.

How to read it, and what inspection changes

Reading the chart. One inspection in January, 43 in September and 16 in December. Each one adds a structured record to the tail and concentration views.

What inspection changes. The more movements inspected, the sharper the picture of where the tail sits.

Computed by iCargoFinsure from the anonymised 2025 inspection file (242 records, 28 Jan 2025 to 20 Dec 2025). Identifiers are replaced by rank labels. See the paper for the authors' own figures and method. Open the full analytics.

What it means

One record, four ways to use it.

Insurers and brokers

See where exposure concentrates and which pairs of carrier and route run hot, then price and condition cover on evidence.

Shippers and assureds

Spot the quiet route or rare operator that carries outsized value, before it becomes a claim.

Surveyors

A standard inspection becomes the data source: every record feeds the same tail and concentration views.

Transporters and EPCs

Fix the constrained stage once and stop delays from compounding down the chain.

Cite

Cite the paper.

Zenodo DOI 10.5281/zenodo.18044161. Keywords as listed on SSRN.

APA

Gowariker, V., Lakshmanan, M., & Bhavani, N. (2025). Re-Engineering Inland Transport Risk: A System-Powered Inspection Stack for Tail-Risk Detection in Indian Over-Dimensional Cargo Movement. Zenodo. https://doi.org/10.5281/zenodo.18044161

BibTeX

@misc{gowariker2025inspection,
  author = {Gowariker, Varun and Lakshmanan, Murugan and Bhavani, N.},
  title  = {Re-Engineering Inland Transport Risk: A System-Powered Inspection Stack for Tail-Risk Detection in Indian Over-Dimensional Cargo Movement},
  year   = {2025},
  publisher = {Zenodo},
  doi    = {10.5281/zenodo.18044161},
  url    = {https://zenodo.org/records/18044161}
}
  • Transport risk analytics
  • Over-dimensional cargo
  • Over-weight cargo
  • Inland logistics
  • Tail risk
  • P90 delay
  • Exposure concentration
  • Risk engineering
  • India road transport
  • Cargo insurance

Questions

About the research.

What is the paper about?

It argues that Indian inland transport risk should be read from inspections made before and during a move, not only from claims and loss runs made after it, and shows how tail delays and concentrated exposure can be spotted earlier in over-dimensional and over-weight cargo.

Where can I read it?

On SSRN at papers.ssrn.com/abstract=6067067 and on Zenodo at zenodo.org/records/18044161 under DOI 10.5281/zenodo.18044161. The Zenodo record is licensed CC BY 4.0.

What does P90 mean?

P90 is the 90th percentile: the delay that nine in ten movements beat. It isolates the slowest tenth, where most of the cost and surprise live.

What does the concentration index mean?

The Herfindahl-Hirschman Index adds up squared shares. It runs from near zero for many equal actors to 10,000 when one actor carries everything.

Where do the charts on this page come from?

They are computed by iCargoFinsure from the anonymised 2025 inspection file of 242 records. Carriers, consignees and vehicles are replaced by rank labels. The readership counts come from SSRN and Zenodo. For the authors' own figures and method, read the paper.

How does this connect to the iCargoFinsure platform?

The platform captures the structured inspections, maker and checker review and unloading evidence that the framework relies on. The Field Academy lets you practise the same steps.


From paper to practice

Run the inspection the paper describes.

Practise the maker, checker and unloading steps in the Field Academy, or book a live demo of the platform.